Beyond the Gut Feeling: Why Hotel Performance Metrics
Are Your Secret Weapon
Category: Hospitality Management & Analytics | Reading Time: 10 Minutes | Author: Javier
Let’s be honest—experienced hoteliers have incredible instincts. You can walk into your lobby and instantly feel the energy. You know when a guest is genuinely delighted, and you can sense when something operations-wise is just a little off.
But here is the hard truth: instinct won’t convince investors. It won’t tell you exactly where your revenue is leaking. And it definitely won’t give you the concrete clarity needed to outsmart your competitors in a crowded market.
The properties winning right now aren’t guessing. They are letting hotel performance metrics do the talking.
Understanding the Difference: Hotel Performance Metrics vs. KPIs
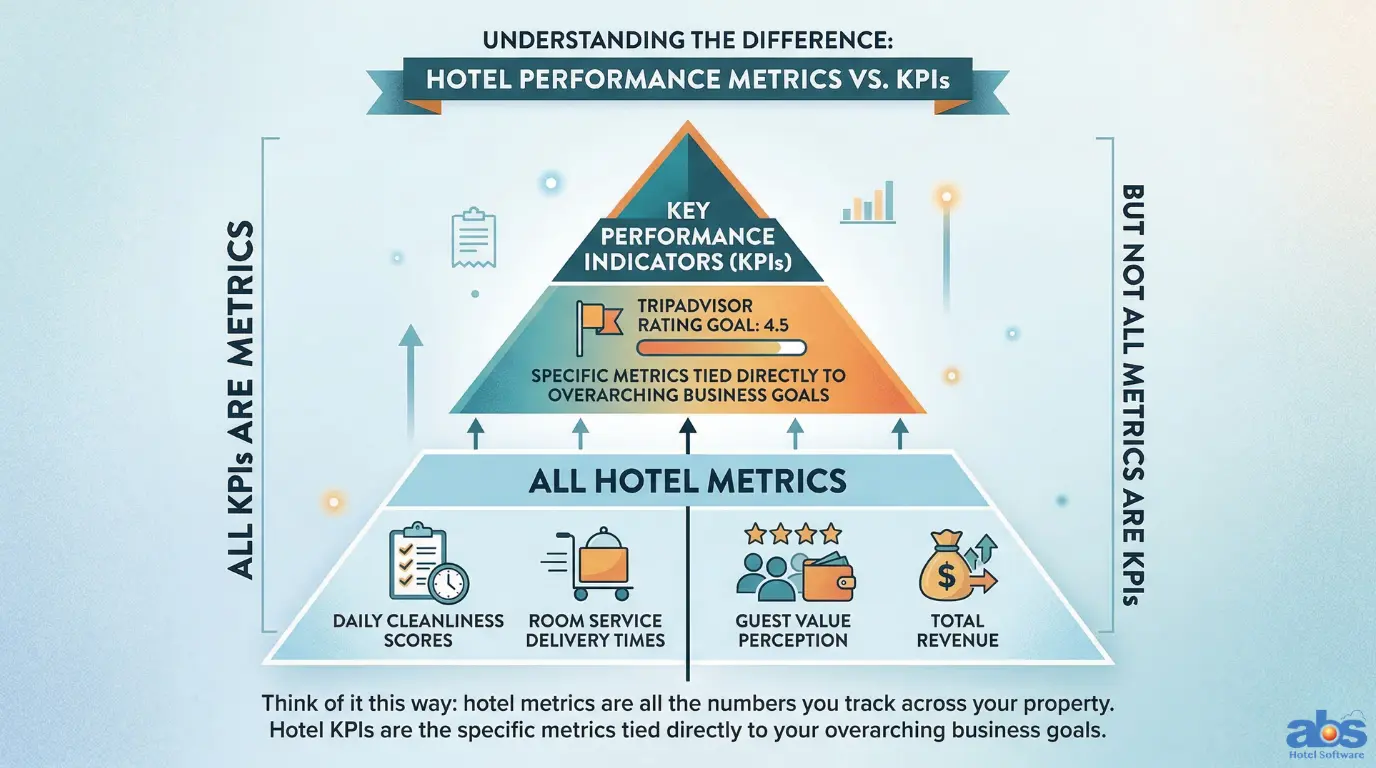
Before we dive into the data, we need to make a quick but vital distinction: all KPIs (Key Performance Indicators) are metrics, but not all metrics are KPIs.
Think of it this way: hotel metrics are all the numbers you track across your property. Hotel KPIs are the specific metrics tied directly to your overarching business goals.
For example, if your goal is to achieve a 4.5 TripAdvisor rating in six months, that rating is your KPI. To get there, you will need to dig into supporting metrics like your daily cleanliness scores, room service delivery times, and guest value perception.
The 7 Core Hotel Performance Metrics You Must Track
To shift from relying on your gut to running a data-driven powerhouse, these are the seven essential hotel performance metrics you need to monitor (and how to move the needle on each).
1. Occupancy Rate: Maximizing Your Property’s Potential
The basics: The percentage of your available rooms that are actually sold over a specific period. Why it matters: It tells you how effectively you are filling your property. However, 100% occupancy isn’t always the ultimate goal. Sometimes, leaving a few rooms empty so you can charge higher rates makes better financial sense. Quick wins to boost occupancy:
-
Re-engage past guests with an irresistible “welcome back” email offer.
-
Consult your OTA market manager about upcoming promotional opportunities.
-
Test a targeted Google CPC (Cost-Per-Click) campaign featuring a compelling seasonal special.
2. Average Daily Rate (ADR): Pricing for Profitability
The basics: The average price guests pay for your rooms on a given day. Why it matters: ADR reveals exactly what travelers are willing to pay for your property. But beware: ADR alone can be misleading. High rates mean very little if your occupancy drops significantly. Quick wins to improve ADR:
-
Create tiered pricing based on room attributes (view, square footage, specific amenities).
-
Bundle rooms with high-value add-ons like breakfast, local wine, or guided experiences.
-
Train your front desk staff on effective upselling techniques at check-in.
3. Revenue Per Available Room (RevPAR): The Hospitality Gold Standard
The basics: The sweet spot of hotel metrics that combines both occupancy and rate. It is calculated by dividing your total room revenue by all your available rooms (sold or unsold). Why it matters: RevPAR tells you if you are successfully finding the balance between filling rooms and commanding profitable rates. Quick wins to boost RevPAR:
-
Ditch static pricing and implement dynamic pricing strategies based on real-time demand.
-
Monitor your competitors’ rates daily and position your property strategically.
-
Use stay restrictions (like minimum lengths of stay) on your busiest nights to capture shoulder-night business.
4. Gross Operating Profit (GOP): The Financial Reality Check
The basics: Total revenue minus your operating costs, factoring in all revenue streams and all departments. Why it matters: This is your reality check. GOP shows you if all your top-line revenue generation actually translates to bottom-line profit.
5. Gross Operating Profit Per Available Room (GOPPAR): The Full-Service Picture
The basics: Takes your GOP and distributes it across every available room in the hotel. Why it matters: While RevPAR only looks at room revenue, GOPPAR considers the whole ecosystem: your restaurant, bar, spa, and event spaces. For full-service hotels, this metric tells the real story of your property’s financial health.
6. Average Length of Stay (ALOS): Reducing Operational Churn
The basics: The average number of nights guests stay at your property per booking. Why it matters: Shorter stays usually mean higher acquisition costs and increased housekeeping turnover. Longer stays are generally more profitable and create less operational friction. Quick wins to extend ALOS:
-
Offer escalating percentage discounts for longer bookings (e.g., “Stay 3 nights, save 15%”).
-
Design packages specifically tailored for “bleisure” (business + leisure) travelers.
-
Implement minimum stay requirements during peak seasons or major local events.
7. Market Penetration Index (MPI): Conquering Your Competitive Set
The basics: A calculation of your occupancy compared to your predefined competitive set (comp set). Why it matters: An MPI below 100 means you are leaving bookings on the table that your competitors are happily snatching up. An MPI above 100 means you are winning the market share game.
Advanced Hospitality Metrics: Digging Deeper into Hotel Analytics
Once you have mastered the core KPIs, these advanced hotel performance metrics will give you an unparalleled view of your business:
-
Average Room Rate (ARR): Similar to ADR, but looks at longer periods (weekly, monthly, seasonally) to help you spot macro-patterns.
-
Revenue Generation Index (RGI): Your RevPAR compared to your comp set. A score of 100 is your fair share; anything above means you’re outperforming the market.
-
EBITDA: Earnings Before Interest, Taxes, Depreciation, and Amortization. This is the metric lenders love because it shows pure operational performance.
-
NRevPAR (Net RevPAR): RevPAR minus distribution costs (like hefty OTA commissions). It shows what you actually keep.
-
RevPOR (Revenue Per Occupied Room): Unlike RevPAR, this only counts occupied rooms and tracks total guest spend (mini-bar, spa, dining).
-
CPOR (Cost Per Occupied Room): Helps you understand your baseline costs. If your rates aren’t covering CPOR, you are losing money on the booking.
-
TRevPAR (Total RevPAR): Total revenue (rooms plus all ancillary revenue) divided by available rooms. The ultimate big-picture metric.
From Raw Data to Revenue Growth: Using Hotel Metrics to Lead
Here is the truth about hotel metrics: they are not just numbers for spreadsheets and investor pitch decks. They are your early warning system. They are your opportunity radar. Most importantly, they are the mathematical proof that your initial instincts were right all along.
Start tracking the hotel data metrics that align with your specific goals. Watch for seasonal patterns. Test rate adjustments. Stop simply reacting to the market, and start using data to lead it.
Because in today’s highly competitive hospitality market, the hotels winning aren’t just the ones with the best instincts. They are the ones smart enough to equip their gut feelings with hard data.
Frequently Asked Questions About Hotel Performance Metrics
Q: What are the most important hotel performance metrics to track?
A: While it depends on your property type, the “Big Three” that every hotel must track are Occupancy Rate, Average Daily Rate (ADR), and Revenue Per Available Room (RevPAR). These provide a baseline understanding of your property’s pricing strategy and demand.
Q: What is the difference between ADR and RevPAR?
A: ADR (Average Daily Rate) only measures the average price of the rooms you actually sold. RevPAR (Revenue Per Available Room) measures your room revenue against all the rooms in your hotel, whether they were sold or empty. RevPAR gives a more accurate picture of your overall revenue performance.
Q: How do I calculate GOPPAR?
A: To calculate Gross Operating Profit Per Available Room (GOPPAR), subtract your total departmental and unallocated operating expenses from your total revenue to get your Gross Operating Profit (GOP). Then, divide that GOP by your total number of available rooms.
Q: Why is my MPI (Market Penetration Index) below 100?
A: An MPI below 100 indicates that your property is getting a smaller slice of the local market share compared to your direct competitors. This could be due to uncompetitive pricing, lower online review scores, poor OTA visibility, or a lack of targeted marketing campaigns.